- Home
- About CATS
- The Transect
- Transect Codes Council
- Resources & Links
- Contact CATS
- CATS Programs
- Research
- Publications
- Education
- AWARDS
- CATS TOOLS
- Codes
- Modules
- Images
All images are available for free download for use in PowerPoint (low resolution) or print (high resolution), with credit as noted.
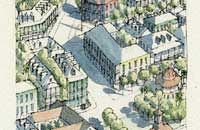 |
Bahamas This diagram illustrates a typical transect in the Bahamas. Bahamian settlements are fundamentally tied to the sea, often at narrow points on the islands. Here the urban core is positioned on a waterfront drive. Starting at the harbor, most Bahamian settlements then gradually decrease in intensity until the transect meets the sea on the island's opposite shore. This diagram was produced for the "Planning Abaco" proposal. Andrews University School of Architecture / Drawing by Brian Reeves |
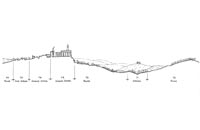 |
Pienza, Italy The left side shows a smooth transition from T2 to T5, but the middle shows a radical jump from T5 to T2 at the city wall. Such juxtapositions, like Central Park, can be intensely stimulating places. Elizabeth Plater-Zyberk / Duany Plater-Zyberk & Company |
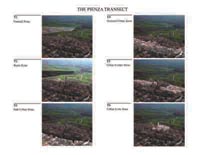 |
Pienza, Italy A first cut for an urban transect analysis can be done from an aerial photograph and then field verified. This is identical to the efficient technique used by ecologists to determine habitat areas. Duany Plater-Zyberk & Company |
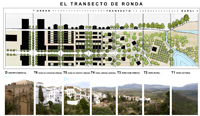 |
Ronda, Spain Ronda was most gracefully photographed with the Urban Core on the left, so the usual T-zone sequence is reversed. This fast-growing town in the Andalucia region of Spain is famous for its dramatic escarpments and the views from the bridge over the El Tajo gorge (Distrito Especial in this illustration). Unlike American T-3 zones, attached building types persist into the lower T-zones in much of Europe. Duany Plater-Zyberk & Company |
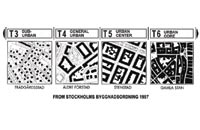 |
Stockholm, Sweden These illustrations are from the new context-based code of Stockholm. Given the marked rural-to-urban variety of the city, it is effectively a transect-based code. Duany Plater-Zyberk & Company |